

Understanding Binary Charts: A Clear Guide
Discover how binary charts simplify complex data 🤓 Learn to read, interpret, and create these charts with practical tips for various fields 📊
Edited By
Benjamin Wright
Binary charts might sound like something out of a tech manual or coding class, but they’re actually quite handy tools beyond just computer science. At their core, binary charts display data using the simple—but powerful—binary system: zeros and ones. Understanding these charts can open new windows for anyone working with data, whether you’re tracking market trends, analyzing trading patterns, or teaching data representation in classrooms.
Why should traders, investors, and financial analysts care about binary charts? Well, binary notation forms the backbone of all digital data, so these charts provide a unique way to simplify complex information quickly. From software engineers to brokers setting up automated alerts, binary charts offer a clear, straightforward snapshot of data's binary patterns.

This guide will break down what binary charts are, walk you through the basics of binary notation, explore different types of binary charts you'll encounter, and show you how to make sense of them effectively. Along the way, we’ll share practical tips and real-world examples to help you apply this knowledge confidently—because binary isn’t just about machines; it’s about making data work for you.
Binary charts are a unique way to visualize data using just two possible values: 0s and 1s. In the financial world, traders and analysts often rely on clear, straightforward visuals to spot trends and make decisions quickly. Binary charts serve this purpose by simplifying complex datasets into a clean, easy-to-digest format.
Unlike traditional charts that show a range of numbers or continuous values, binary charts highlight the presence or absence of a condition. For instance, a trader might use a binary chart to indicate whether a stock closed above or below a specific price threshold each day—marking it as 1 if above, or 0 if below. This binary approach can help cut through noise and spotlight patterns otherwise hidden in regular price charts.
The importance of binary charts lies in their ability to focus on yes/no or on/off states in data. They’re especially useful when you want to track occurrences or shifts without getting bogged down in the exact values. This makes them handy tools not only in finance but also in digital electronics, computer science, and even medical monitoring systems.
By understanding what binary charts are, professionals across sectors can harness their practical benefits, from simplifying data analysis to improving decision-making speed. In the sections ahead, we'll examine how these charts work and how to read them effectively.
At its core, a binary chart is a visual representation where each data point corresponds to one of two states: typically 0 or 1. These charts strip down information to its simplest form, making patterns easy to catch at a glance.
Imagine a heatmap where each cell is either black or white, depending on whether a condition is met. Or picture a bar chart where bars either stand tall (1) or vanish (0) to show the presence or absence of a feature over time. That’s the essence of binary charts — minimalism with meaning.
One example is in algorithm trading: a binary chart could show a signal that triggers a buy (1) or no action (0). Instead of messy price movements, the trader gets a clear yes-or-no visual prompt.
By focusing on binary states, these charts provide a direct way to track metrics that are inherently dualistic, like success/failure or on/off statuses.
Binary digits, or bits, are the foundation of how computers and binary charts work. There are only two digits: 0 and 1. These aren’t just random choices; they reflect the electrical states in computers where a circuit can be either off (0) or on (1).
In practical terms, each bit represents a tiny piece of data. When you string bits together, you create meaningful information. For example, the number 5 in binary is written as 101, meaning the first and third bits are on, while the middle bit is off.
For traders and analysts, understanding these simple digits helps in interpreting binary charts correctly. Each bit can represent a flag—something either true or false, present or absent. This simplicity lets you focus on key indicators without distraction.
Binary represents data by assigning each bit a position that corresponds to a power of two. Starting from the right, each bit’s value doubles the previous one. When a bit is set to 1, its value counts towards the total; if it’s 0, it doesn’t.
Take binary 1101 as an example:
The rightmost bit is 1 (1)
Next bit to the left is 0 (0)
Then 1 (4)
Leftmost is 1 (8)
Add them up: 8 + 0 + 4 + 1 = 13 in decimal.
This method means binary can represent any number, but in charts, it’s often used more qualitatively. For example, each bit could show if a stock meets specific criteria: a 1 for yes, 0 for no. When combined, these bits map out a bigger picture across time or categories.
Binary 'ttingen data this way puts complex info into a neat package, making trends simpler to spot and decisions easier to make.
Understanding this dual state system is key to reading and creating useful binary charts, whether you’re analyzing markets, running simulations, or studying patterns.
Understanding the different types of binary charts is essential for anyone looking to interpret or use binary data effectively. Each type of chart presents binary data in a unique visual format, making it easier to analyze patterns, trends, or anomalies depending on the context. For traders, investors, and analysts, choosing the right type of binary chart can significantly impact the clarity and effectiveness of data presentation.
Binary bar charts use vertical or horizontal bars to represent binary values, typically 0s and 1s. One common approach is to assign one color to the digit 1 and another to 0. This way, viewers can instantly spot sequences or clusters of ones and zeros. For example, in financial market analysis, a binary bar chart might show trading days when a stock closed higher (marked as 1) versus lower (marked as 0). This visual helps traders quickly identify winning streaks or downturns.
The strength of binary bar charts lies in their straightforwardness—each bar corresponds to a binary value, making comparisons simple. However, it's important not to overload the chart with too many bars, as this can overwhelm the viewer and reduce readability.
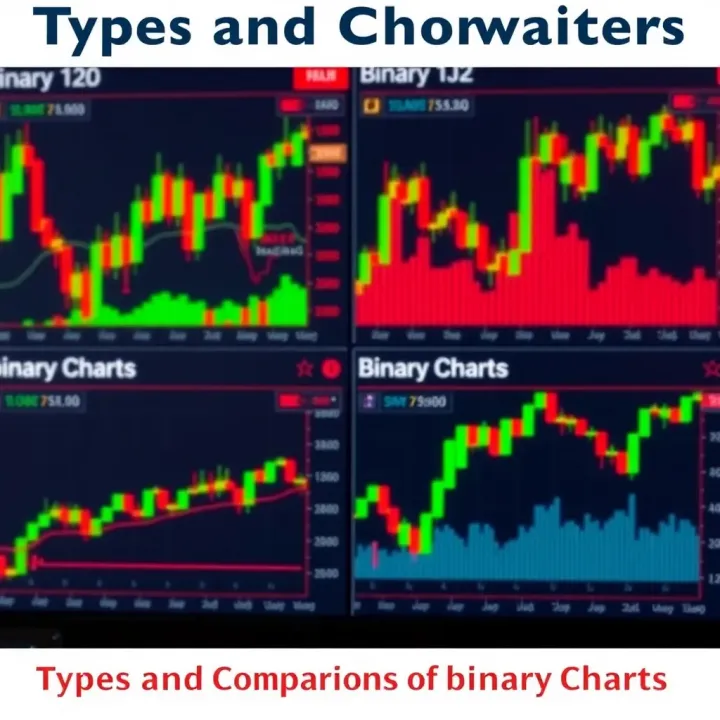
Binary line charts connect binary data points along a continuous line, showing transitions over time or a sequence. Imagine mapping out a binary signal that switches between on (1) and off (0); a binary line chart makes the jumps easy to follow. This type is especially useful in technical analysis where binary states indicate buy or sell signals.
For instance, a brokerage system might use a binary line chart to track whether certain technical indicators are triggered daily (1) or not (0). This clear on-off visual helps brokers quickly assess the stability or volatility over a period.
However, line charts can sometimes obscure the discrete nature of binary data, so they work best when used to highlight changes or trends rather than raw values alone.
Binary heatmaps represent binary data in a matrix of cells, each cell colored based on whether the value is 0 or 1. This format is excellent for showing patterns across two dimensions, like days versus hours or different asset classes against market conditions.
A practical example would be a binary heatmap illustrating an investor's portfolio performance through the week—green cells for positive returns (1) and red for negative (0). It quickly reveals hot spots and weak points.
Grids help visualize large datasets compactly and can uncover spatial or temporal correlations that other charts might miss. However, it's essential to choose contrasting colors carefully to avoid confusion, especially for viewers with color vision deficiencies.
When working with binary charts, always consider the audience and the kind of insight you want to deliver. The right chart type not only conveys data clearly but also speeds up decision-making, a key factor in financial trading and analysis.
By familiarizing yourself with these chart types, you gain better control over how binary data can be visualized and interpreted in your field, whether you're making investment choices or teaching binary concepts.
Reading binary charts might seem a bit like cracking a code at first, but once you get the hang of the visual cues, it becomes a straightforward way to understand complex binary data. This skill is especially handy for traders, investors, or financial analysts looking to quickly interpret data encoded in binary format. Mastering how to read these charts helps you spot trends, anomalies, or patterns that might not be obvious in traditional charts.
At its core, interpreting binary values on a chart means translating sequences of 1s and 0s into meaningful information. Each binary digit (bit) represents a state—often 'on' or 'off', 'true' or 'false'. Visually, this is often represented with colors, shapes, or filled versus empty spaces.
For example, in a binary bar chart, a black bar might represent a '1' and a white bar a '0'. If you see the sequence 1011, it visually breaks down into a pattern of bars that can be read left to right (or right to left, depending on the context). The clarity comes from understanding what the bits stand for in your specific use case: are these buy/sell signals? Data flags? Status indicators?
In practical terms, consider a binary line chart monitoring market activity where "1" means high volume and "0" low volume. Spotting clusters of "1"s can hint at heightened market interest, while strings of "0"s might signal low activity periods.
When scanning binary charts, certain patterns stand out frequently and carry significant meaning. Experienced analysts learn to recognize these at a glance:
Runs: Long strings of 1s or 0s suggest sustained states, like continuous profit or loss phases.
Alternating Patterns: Regular flips between 1 and 0, such as 101010, might indicate volatility or cyclical events.
Clusters: Blocks of 1s grouped together could reveal bursts of activity or positive signals.
Gaps: Sudden absence or drop-offs in 1s may highlight market pauses or downturns.
Each of these patterns helps simplify complex data streams. For instance, an investor using a binary heatmap to track several stocks might quickly pick out several short runs of 1s indicating consistent buying pressure in a sector.
Remember, the key is to tie these visual patterns back to what they represent in your context. Binary charts aren't just about the numbers—they're about what those numbers mean for decision-making.
Reading binary charts boils down to matching the visual language to the underlying data logic. It takes practice, but once you’re fluent, these charts can become a powerful tool to cut through information noise and spot opportunities fast.
Binary charts serve as a powerful tool in many fields, especially where digital information representation is key. Their applications range from the inner workings of computers to creating intuitive data visualizations that help us solve complex problems.
In this section, we'll explore two main areas where binary charts take center stage: computer science and digital electronics, and data visualization and problem solving. Understanding these applications can increase your ability to read and create binary charts effectively, particularly if you're involved in technical analysis or data-driven decision making.
Binary charts form the backbone of digital technology. Computers store and process all information in binary — 1s and 0s — so representing this data visually through binary charts can clarify how data flows and changes.
For example, in computer science, binary charts help visualize logic gates and circuits. A logic gate like an AND gate operates by outputting true (1) only when all its inputs are true, which can be mapped clearly in a binary chart. This visual representation assists engineers and learners in debugging and designing circuits.
Digital electronics also use binary charts to illustrate memory states or microcontroller operations. Consider a microcontroller’s register: each bit represents a specific function or status flag. Mapping these bits in a binary chart makes it easier to track what each part of the system is doing at any point. It’s like having a snapshot of a machine’s inner workings on a grid.
Without binary charting, interpreting digital system states would feel like decoding a secret language without the key.
Binary charts go beyond electronics by helping us simplify complex data patterns into clear visuals. In financial markets, for example, traders might convert large datasets of market signals into binary form to quickly see up/down trends or buy/sell signals using binary line or bar charts.
Data scientists use binary heatmaps to highlight presence/absence patterns, such as tracking whether a certain event happened over days or which features are active in a machine-learning model. This approach helps pinpoint anomalies or trends faster than scanning raw data.
Moreover, these charts are used in error detection and correction. Imagine a communication system sending data over various channels — binary charts help visualize error patterns so engineers can tweak transmission protocols or improve reliability.
In summary, the ability to visually parse binary data boosts problem-solving capabilities by making hidden patterns more accessible, whether you’re analyzing traffic flow, genetic code, or stock performance.
Using binary charts is not just about seeing ones and zeros; it’s about gaining insight and making informed decisions based on how data behaves in binary form.
Creating your own binary charts is a handy skill for anyone working with digital data or financial indicators that rely on binary representations. It’s not just about drawing graphs but about understanding how raw binary data translates into visual insights. When you craft your charts, you get better control over how data is displayed and interpreted, which is crucial for traders and analysts who need precision and clarity. Picture an investor spotting a pattern earlier than others because their binary chart laid it bare in a straightforward manner.
Picking the right software makes a world of difference. For binary chart creation, tools like Microsoft Excel or Google Sheets are often underrated. They offer basic capabilities for plotting binary data once you’ve converted it. For more specialized needs, software like MATLAB or Python's matplotlib library allow for customization and handling large datasets effortlessly. The key is to choose a tool that can process and visualize binary data without complicating the process. Keep in mind, you don’t always need the fanciest tool; simplicity sometimes wins, especially when a quick decision matters.
Sometimes, the old-fashioned way still cuts it. Manual charting—using graph paper or simple drawing tools—helps especially in educational settings or when the data size is manageable. This hands-on method builds a deeper understanding of the relationship between binary numbers and their visual representation. For example, you might sketch a simple binary heatmap to highlight 'on' and 'off' states in a stock’s daily movement manually. It's slower but offers a grounded feel for the data before jumping into automation.
First, you need solid data. This could be anything binary in nature—like a sequence of buy/sell signals where buy = 1 and sell = 0. Gathering your data thoroughly is essential because garbage in will definitely result in garbage out. Sources could be trading platforms, custom indicator results, or historical datasets. Make sure data is clean and consistent, as even slight errors here snowball during conversion and plotting.
Next up is conversion. If your data’s not already in binary, this is the crucial step where numbers, signals, or other formats get translated. For instance, converting price movements into binary might mean representing upward trends as 1 and downward as 0. This simplification helps in recognizing patterns that might not pop out in raw figures. Tools like Python's bin() function can automate this, or you might do it manually for small datasets to keep track of each step.
Finally, it’s time to bring the chart to life. Whether you’re using software or plotting on paper, plot data points carefully to maintain accuracy. A binary bar chart could use black and white bars to show 1s and 0s, while a heatmap might use colors to indicate different binary states. Label axes clearly, so users can quickly interpret the data. For example, plotting trading days on the x-axis and binary signals on the y-axis instantly reveals streaks of buying or selling pressure.
Tip: Always double-check your binary conversions and chart labels. Missteps here can mislead your whole analysis.
Creating binary charts may feel a bit math-heavy at first, but with the right approach, it becomes a powerful visual tool, especially in fields like finance where the fine details matter the most.
Working effectively with binary charts requires some practical know-how beyond just understanding their basics. These tips help traders, investors, financial analysts, brokers, and educators not only avoid common pitfalls but also enhance the clarity and usefulness of their binary data presentations. You'll find that even small adjustments can make your charts significantly easier to read and interpret, leading to better decision-making.
One frequent mistake is mixing different binary scales without clear indication. For example, if you're showcasing binary data representing stock price shifts next to volume traded in binary, make sure to label the scales accurately. Otherwise, it’s easy for anyone reading your chart to get lost or draw false conclusions.
Another pitfall is overloading charts with excessive binary data. Imagine a chart with 64-bit binary numbers cluttered without grouping or spacing—this becomes a headache to decode quickly, especially under time pressure like market analysis. It's better to break the data into manageable chunks or focus on key segments rather than dumping it all at once.
Keep in mind colors and symbols used to represent binary '1's and '0's. Avoid ambiguous color choices like pale gray and off-white that might blend on some screens. Instead, contrast sharply — black and white or blue and yellow tend to serve well. Always test your chart visuals on different devices to spot such readability issues early on.
To make your binary charts clear, start with consistent formatting. Use a uniform font size and style that remains legible even when you zoom out or print the chart. Binary digits can become tiny dots when crammed into smaller areas, so adjust spacing accordingly.
Labels should be straightforward and placed near their respective data points. Including a brief legend or guide saying what a '1' or '0' signifies in your chart prevents confusion, especially if you're presenting binary data representing different variables. For example, a binary chart representing bullish vs bearish signals should make what each binary digit means crystal clear.
When plotting large binary sequences, consider employing heatmaps with binary values mapped to color intensities rather than raw '0' and '1' labels. This method allows spotting patterns or anomalies faster without decoding each digit manually.
Always test your binary charts with a fresh pair of eyes or ask a colleague unfamiliar with the data to interpret them. This can uncover unclear spots you might overlook after repeated exposure.
Finally, remember to keep your audience in mind — a trader scanning charts quickly needs different visual cues than an analyst conducting deep dives. Tailoring visual complexity to your viewers makes your binary charts way more effective and appreciated.
By paying attention to these simple yet critical tips, you'll create binary charts that truly work for their purpose — delivering clear, actionable information without choking your readers with complexity or confusion.
Discover how binary charts simplify complex data 🤓 Learn to read, interpret, and create these charts with practical tips for various fields 📊

📊 Get a clear, practical guide on binary accounts in trading. Learn how they work, key concepts, benefits, risks, and best practices for smart decisions.
📊 Discover how binary variables work, their types, and practical tips for stats, data analysis, and coding. Learn to handle binary data clearly and avoid errors.
🔍 Explore practical insights into binary analysis tools in Kenya! Learn their types, features, challenges, and tips for effective use in tech environments.
Based on 9 reviews